5th December 2021
London is...
After every London derby, the winning team gets to declare "London is blue!" or "London is red!" or "London is [insert club colours]". In honour of this tradition, I've used spatial analysis to attempt to answer the question "what colour is London?" from a different angle.
I used the NNJoin plugin for QGIS to find the nearest Premier League stadium for each ward in London. There are several different ways in which London can be split into districts and areas. I opted to use the wards provided by Greater London Authority here. The 2018 file splits London into 657 wards: politically defined areas used for reporting on local trends.
Using the NNJoin function to calculate the nearest stadium produces a map that looks like this:
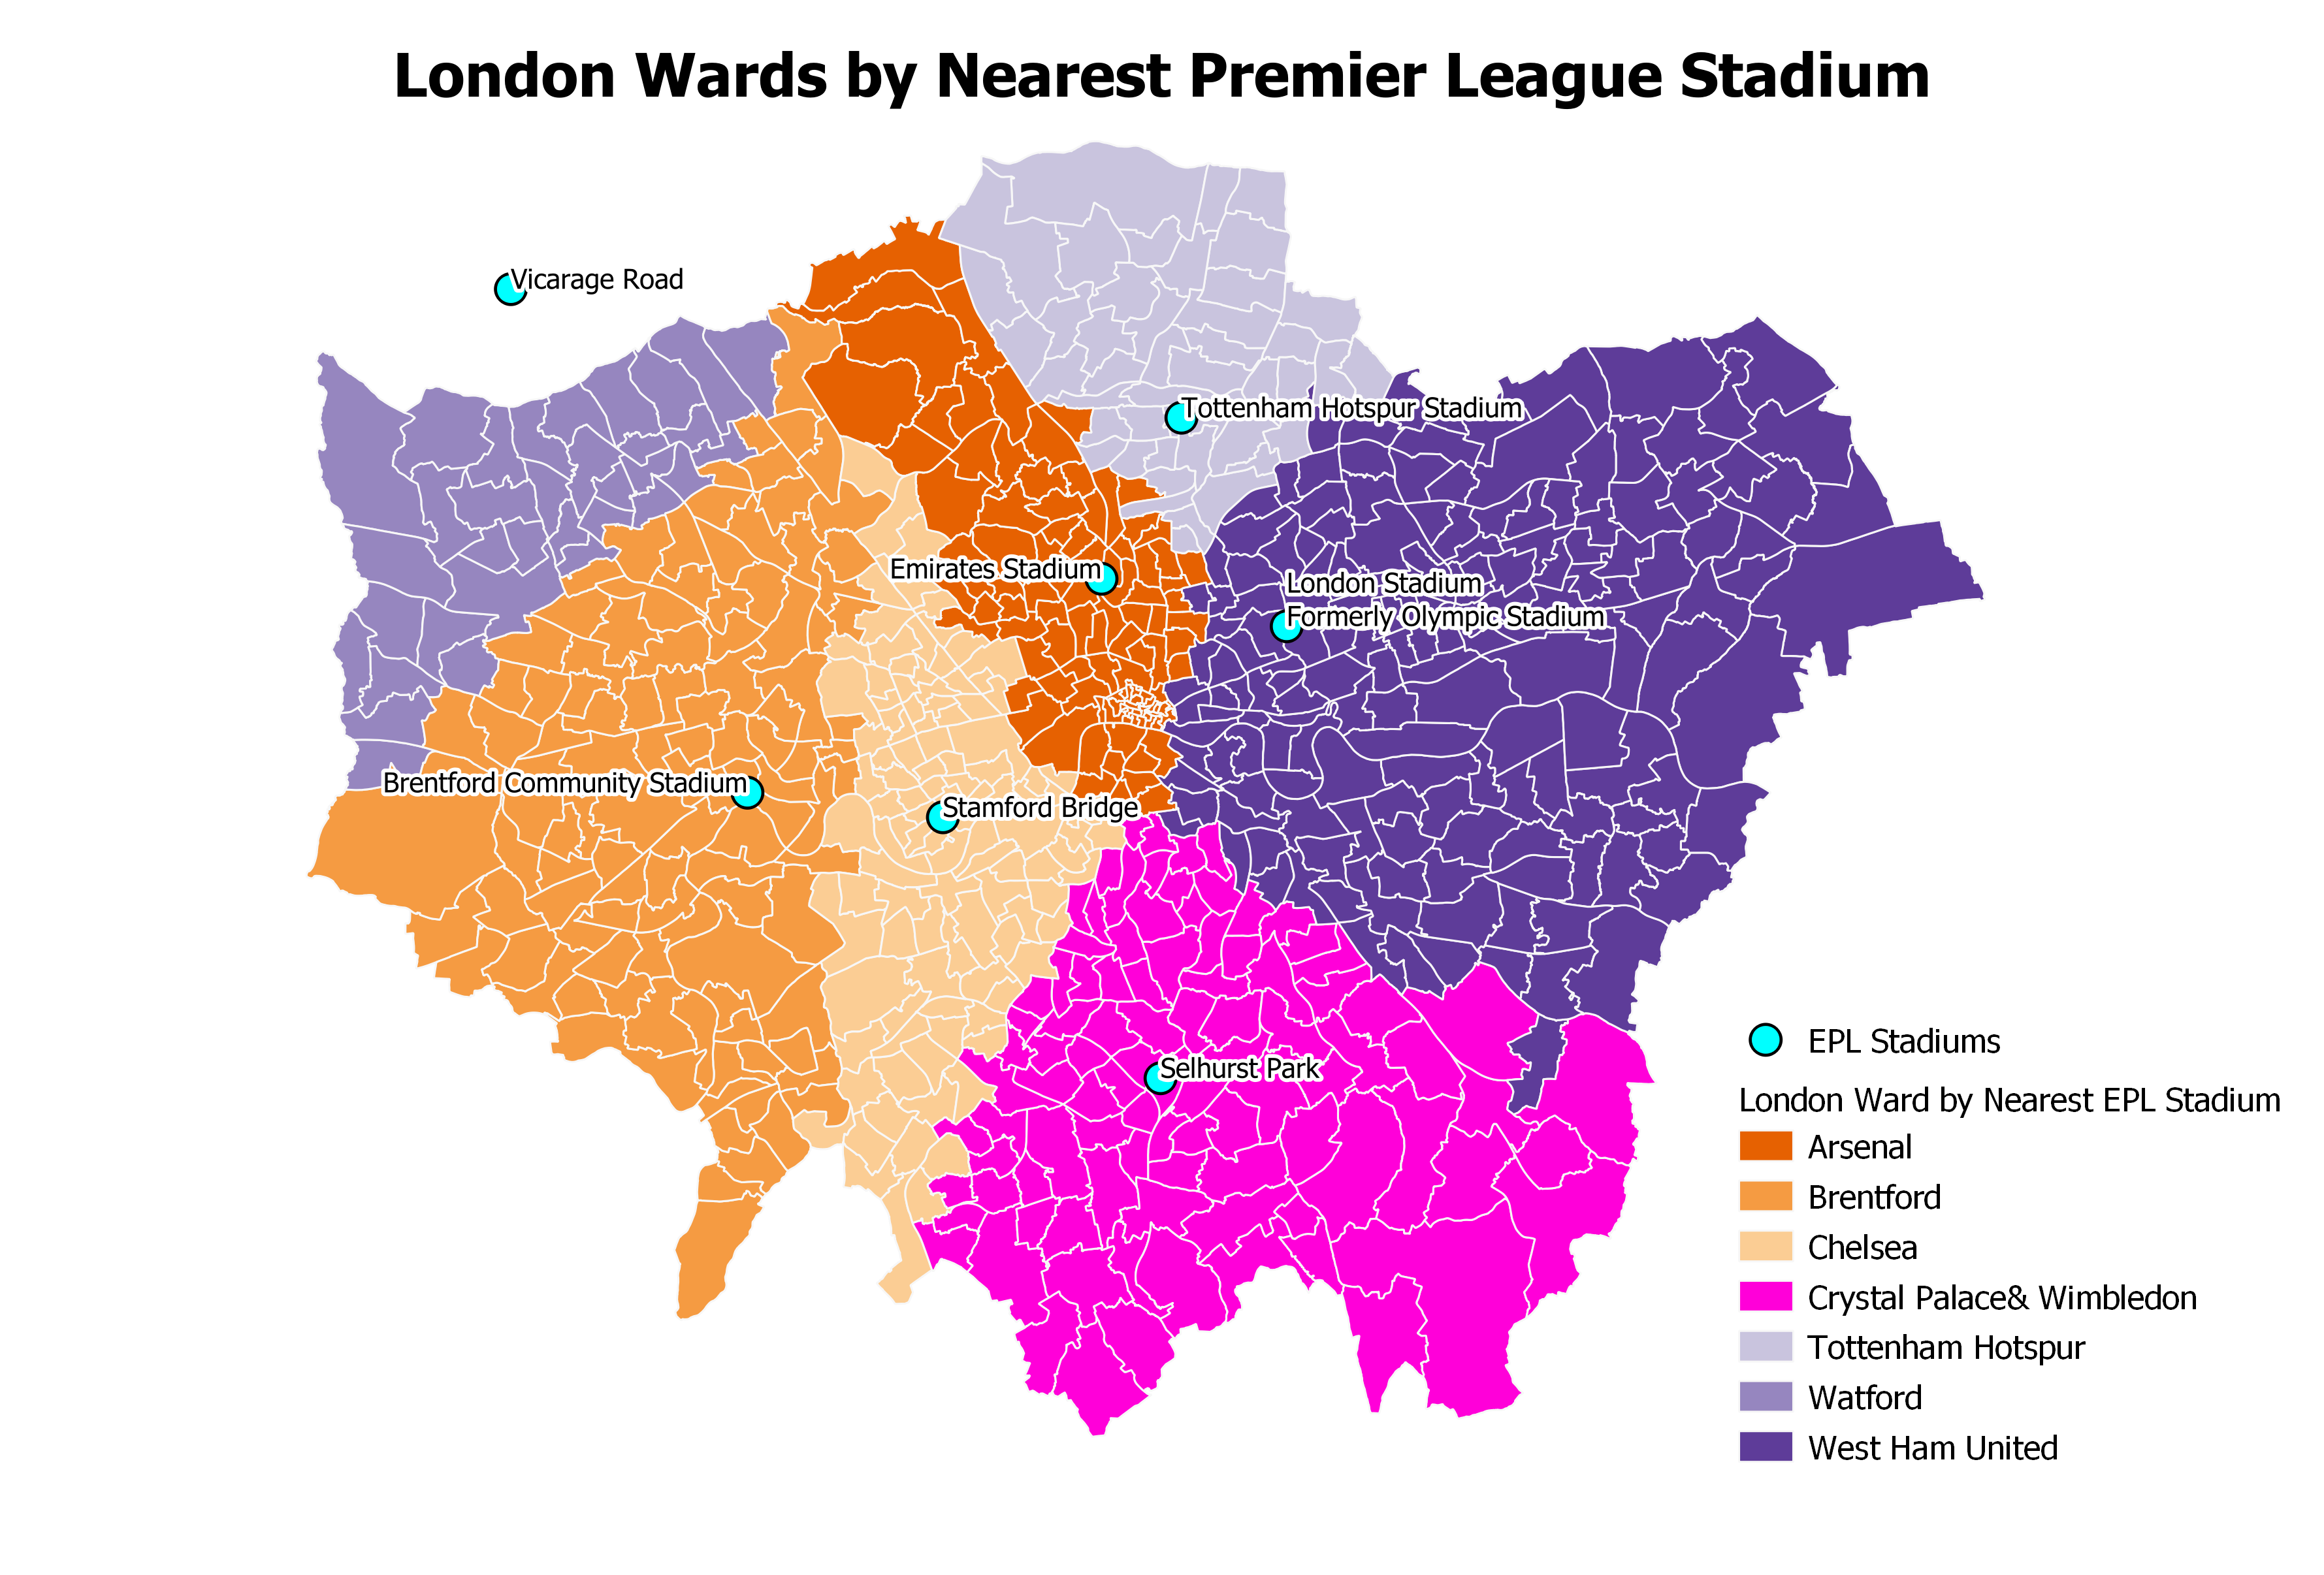
This map offers a sense of the territory of each club, but which club has claim to the most wards in London? Let's give that club "London is" bragging rights.
